Real-time metrics
Live figures update in place, so analysts can watch the market move without reloading anything.
An immersive fintech brand with the data to back it up: real-time financial metrics, visualised for Middle Eastern markets.
03 / 14 · Fintech Platform
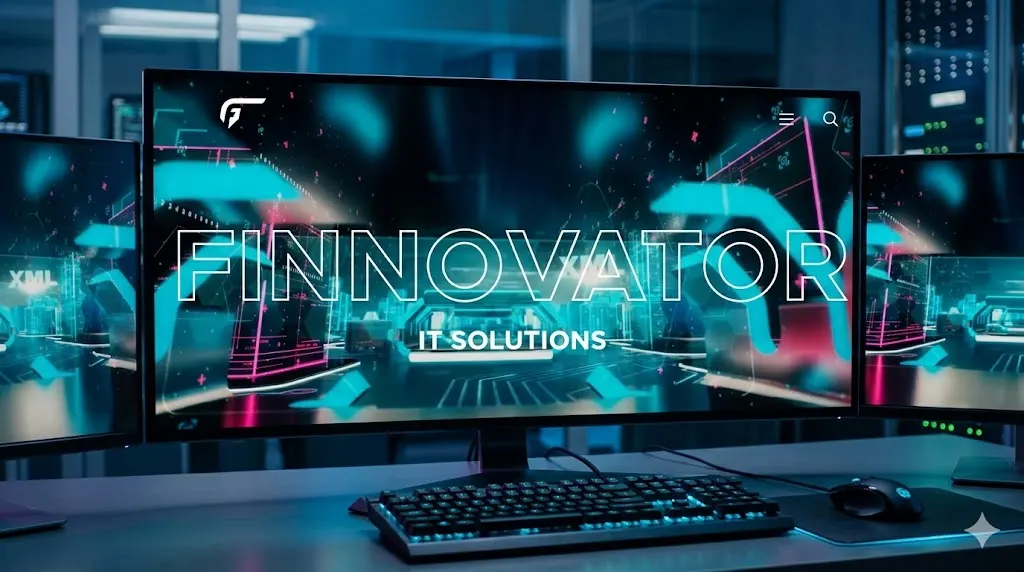
Finnovator works where finance meets technology across the Middle East. Its audience reads numbers for a living, so the platform had to present live financial metrics clearly, and the brand around it had to feel as advanced as the technology underneath.
An immersive, neon-lit brand experience that sets the tone from the first frame, paired with a dashboard that turns dense, real-time financial data into charts and figures people can read at a glance. Clear hierarchy, consistent colour logic and responsive layouts keep complex information calm.
A complex dashboard displaying real-time financial metrics for Middle Eastern markets.
Live figures update in place, so analysts can watch the market move without reloading anything.
Charts, tables and KPIs follow one colour and type system, so dense data stays scannable.
A cinematic, 3D-style hero introduces the company before the numbers take over.
Designed for Middle Eastern markets and audiences from the very first wireframe.
Mapped the metrics that matter and who reads them.
Dashboard information architecture and an immersive brand system.
Real-time data layer, charts and responsive UI.
Launch, monitoring and performance tuning.
Tell us about your project. We'll show you how we'd approach it, with a free consultation and a project plan within 48 hours.